
Last updated on

Google has unveiled a novel feature in Google Analytics aimed at detecting trend changes.
This fresh functionality enables users to readily pinpoint subtle yet significant alterations in data trends as time progresses.
The trend change detection feature is specifically engineered to identify gradual, prolonged shifts in metrics, rather than abrupt spikes or declines.
While Google Analytics currently includes anomaly detection to flag unusual surges or plunges, this latest addition hones in on subtler alterations in data trends that unfold over weeks or months.
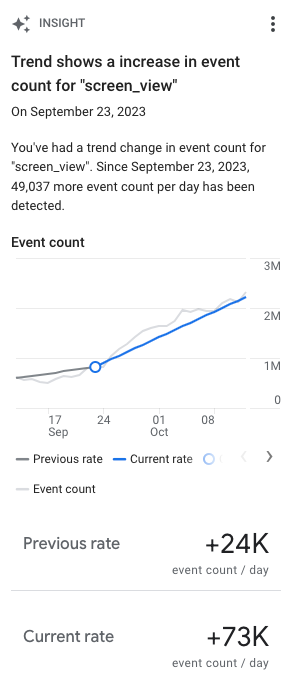
Upon detecting a shift in the direction of time-series data for a metric, Google Analytics places a marker on charts and graphs, indicating the date of the change.
Hovering over the marker reveals specifics about the alteration, such as the previous and current rates of change, as well as the precise date when the trend transitioned.
By selecting “Investigate Report,” users can delve into a more comprehensive view to conduct further data analysis. Here, they have the flexibility to modify the date range, compare additional dimensions, and incorporate breakdowns to gain deeper insights into the factors influencing the trend change.
Identifying unexpected downward trends is crucial for investigating their causes. For instance, a website’s code update might unintentionally disable a registration button, resulting in a halt in user growth.
Without trend change detection, it could take weeks or even months to recognize the gradual decrease in new registrations.
Google Analytics employs a signal segmentation algorithm to pinpoint trend changes in time-series data. For daily data, the algorithm analyzes roughly 90 days of historical information. For weekly data, it scrutinizes approximately 32 weeks to flag potential trend alterations.
Trend changes will be showcased in the following areas within the Google Analytics interface:
The new detection capability is engineered to highlight the following categories of trend changes:
Utilizing Google’s new detailed trend tracking offers a competitive advantage in pinpointing both opportunities and threats within organic data patterns.
By consistently monitoring organic traffic metrics on a weekly and monthly basis, you can swiftly identify unexpected downward trends, which may signify potential issues such as:
Early detection of these trend changes empowers you to promptly investigate and tackle the underlying causes, thereby mitigating potential setbacks.
Original news from SearchEngineJournal