
Last updated on

The rise of Digital PR within SEO circles has surged as a premier substitute for traditional link building strategies.
Digital PR stands out as an alternative approach because it transcends mere link acquisition; it serves as a means to facilitate audience engagement with your content, journalists to amplify your expertise, and consumers to develop trust in your brand.
While acquiring links remains a favorable outcome, the true value lies in fostering broader engagement.
Certain types of campaigns prove to be particularly adept at garnering both links and shares.
Online audiences gravitate towards data presented in easily digestible visual formats that weave a compelling narrative.
For instance, consider my recent LinkedIn post, which garnered an impressive 57,000+ impressions, elicited 80 comments, and received 190 likes.
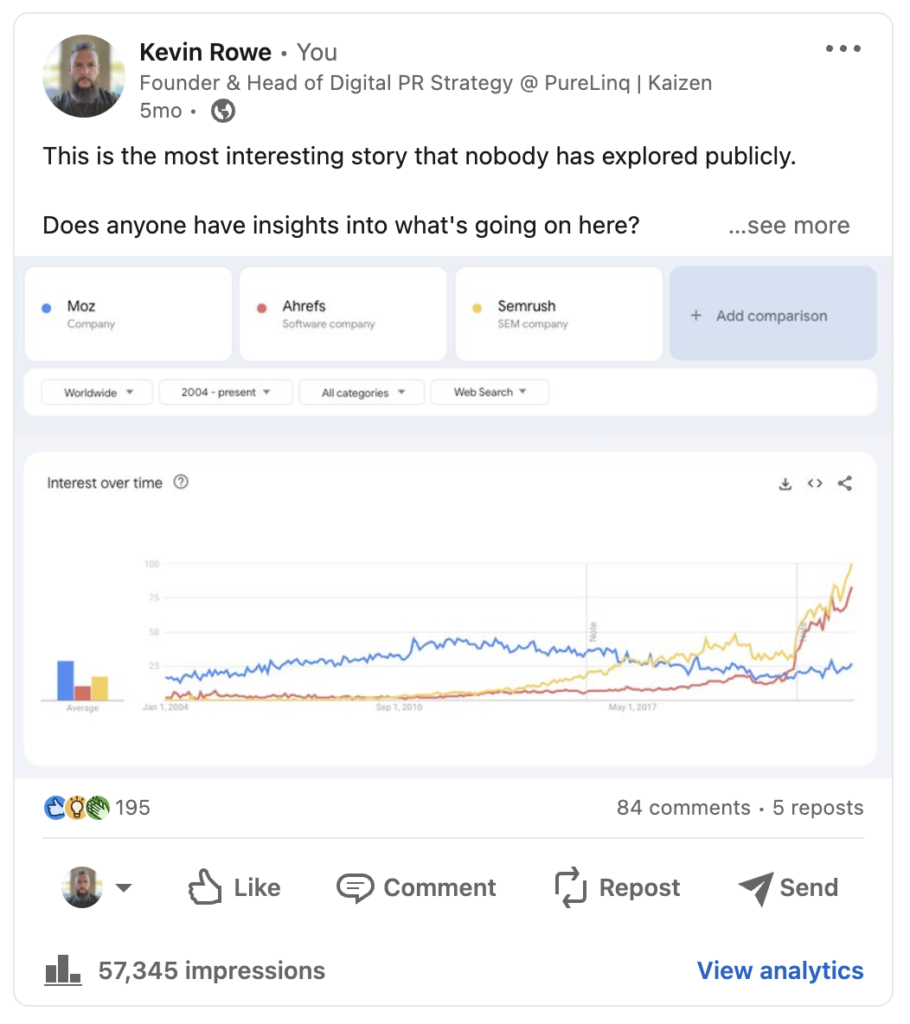
While these figures might appear commonplace for an influencer, I’m not inclined to pursue influencer status; I prefer to operate behind the scenes, ensuring things run smoothly.
Yet, like many of you, I am drawn to unique and compelling insights.
Substantiated data paired with insightful expert commentary has the power to unveil actionable findings that drive engagement.
Recognizing this, journalists and content creators leverage data campaigns extensively. It’s why I frequently employ data-driven approaches in my digital PR efforts.
In the following section, I’ll outline four distinct types of data campaigns that effectively merge digital PR and SEO. These strategies are seldom discussed, if ever, but yield significant results.
Various approaches include:
Below is a similar approach that I’ve utilized with clients such as Hyatt Hotels, The Hartford, and RingCentral:
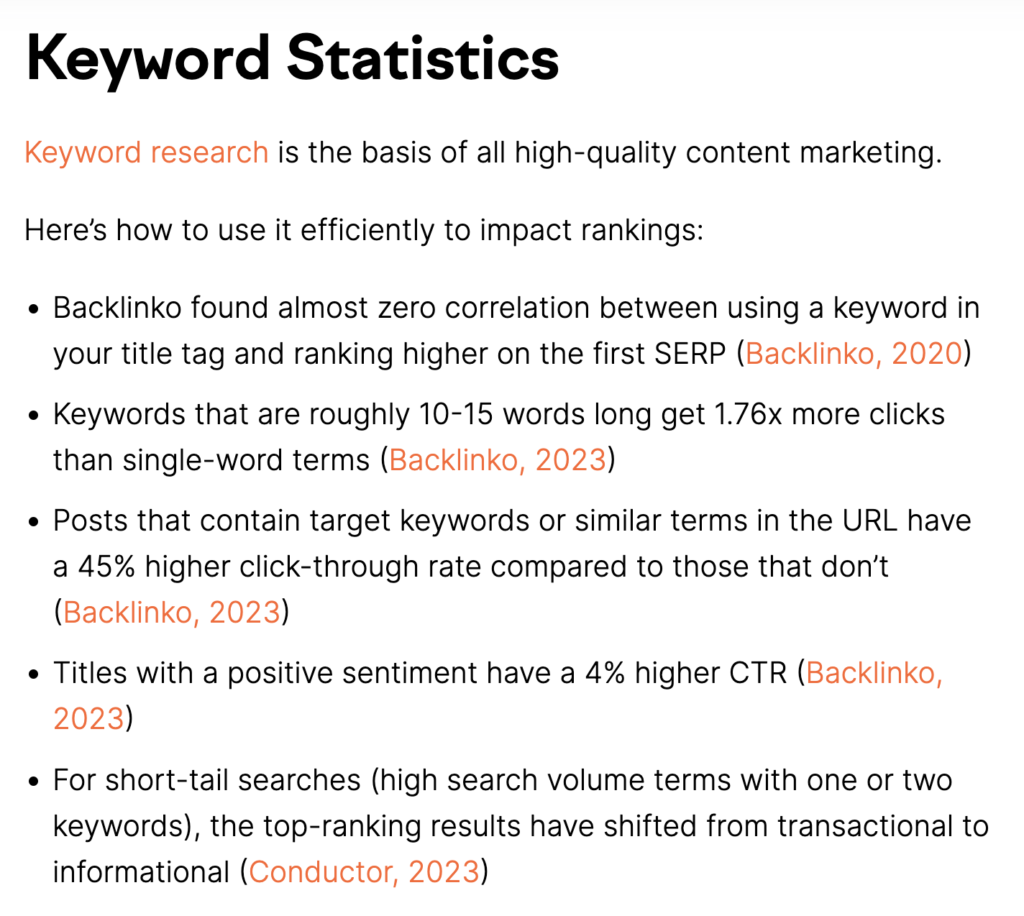
Pat Reinhart, Vice President of Services at Conductor, a leading enterprise SEO software company, emphasized the evolving landscape of SEO, which now revolves around the buyer’s journey. He highlighted Google’s utilization of AI for sophisticated reputation analysis.
Reinhart emphasized the significance of user experiences, particularly during the purchasing phase, as essential for fostering trust and comprehension. He suggested that integrating these narratives into digital PR efforts can significantly enhance a brand’s online reputation.
Now, what exactly does a data-driven campaign entail when put into practice?
Data campaigns yield a diverse array of outcomes, including:
While a data campaign may not always result in securing a backlink, it’s worth noting that the significance of links has diminished compared to the broader context of the buyer journey and overall brand experience.
Reinhart further emphasized the evolving role of links and other factors in shaping a site’s reputation, stating, “[Links matter less now], but that doesn’t mean they aren’t still important.” He likened the evolution of Google’s ranking factors to a pie, where links once occupied a substantial portion. However, as more factors have been introduced into the algorithm, the influence of links has proportionally decreased.
Let’s explore some examples to illustrate these points.
I contacted my friend Juliet Travis, the founder of Liftoff Communications, a PR firm, for an illustration.
Juliet has been instrumental in my understanding of PR, so I turned to her for a compelling example. She graciously shared insights about her campaign with the prominent training technology company, Kahoot!.
Kahoot!’s 2023 Workplace Culture Report is an informative resource offering insights into the distinct needs and aspirations of frontline workers, available for download.
Thanks to effective PR efforts, the report garnered mentions of its name and expert commentary from Kahoot!’s internal team across various platforms.
For instance, in a feature on TechRadar, the editor referenced the brand and incorporated data from Kahoot! but omitted direct links to the report.
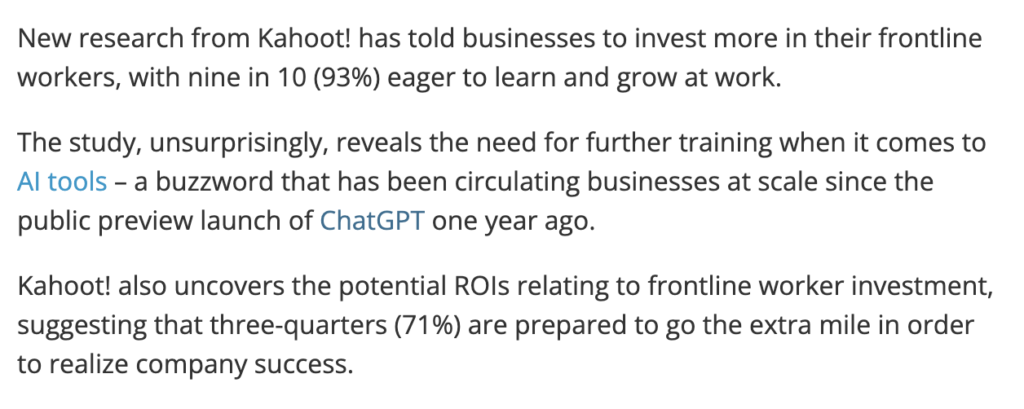
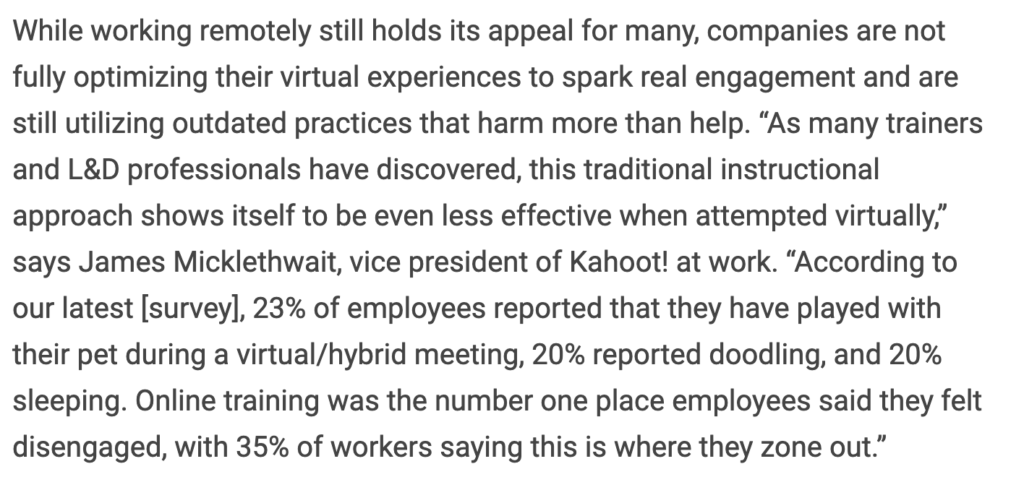
In HROtoday’s article titled “Reengaging Gen Z,” yet another instance of the Workplace Culture Report is featured, accompanied by a quote from Kahoot!’s Vice President, James Micklethwait. However, similar to the previous example, no direct link to the report is provided.
Recent advancements in Google’s AI capabilities underscore the importance of including both links and citations in any digital PR strategy. AI systems can effectively recognize the source of citations and brand mentions, as well as the presence of links.
Therefore, a comprehensive measure of a campaign’s success should encompass various factors, including the acquisition of links, brand mentions, quotes, and citations.
Joe Berkowitz, in a Fast Company Opinion Column, penned an article detailing his experimentation with the social media platform LinkedIn.
Within the article, Berkowitz provides a notable instance where data was used to secure a link, yet the source’s name remained undisclosed.
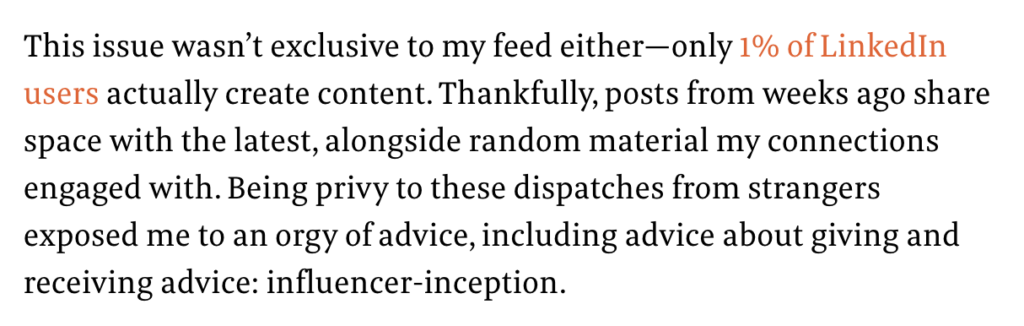
Specifically, Berkowitz referenced data attributed to Lillian Cotter, revealing that merely 1% of LinkedIn users engage in content creation, underscoring the significance of producing original content.
Despite the simplicity of the data compilation process, it garnered a link from one of the most challenging publications to obtain mentions or links from.
The 2022 Ecommerce Playbook by Conductor garnered a noteworthy mention and backlink in Semrush’s prominent article on the Top 106 SEO Statistics.
This instance stands out to me because while Conductor competes with Semrush in certain domains, the blog post still included a reference and link.
Disclaimer: While PureLinq, my company, was previously affiliated with Conductor, this was not the case during the time of this research.
I chose to highlight this example because it underscores Conductor’s approach of fostering enduring partnerships beyond mere competition. Hence, it’s no surprise that they received acknowledgment and a link from a competitor.
These instances underscore how valuable data can be in earning media coverage and backlinks. Therefore, as you implement campaigns akin to the four types outlined below, keep in mind the importance of both coverage and backlinks.
The survey-first approach begins by crafting a survey tailored to the interests of the audience, which is then distributed to journalists within relevant niches.
This strategy involves collecting authentic data and insights directly from the target audience or specific market segments. It stands in contrast to the traditional method of initially analyzing media trends to glean insights related to those trends.
I prefer initiating the process by unearthing insights from the audience because it often yields highly pertinent information about what matters most to them, insights that may have remained undiscovered by others.
This approach essentially paves the way for the creation of a completely new narrative or storyline.
This process prioritizes the customer’s needs and experiences:
Consider utilizing LinkedIn surveys or posts as a swift method to pinpoint the pain points of your target audience.
Primarily, I leverage LinkedIn by crafting posts and surveys to gauge the interests of my connections. If a particular post generates significant engagement or sparks a lively discussion, I then contemplate transforming it into a survey.
Moreover, by analyzing the demographic of the audience that actively engages with these posts, you can discern the specific audience segment likely to be intrigued by such content or perspective.
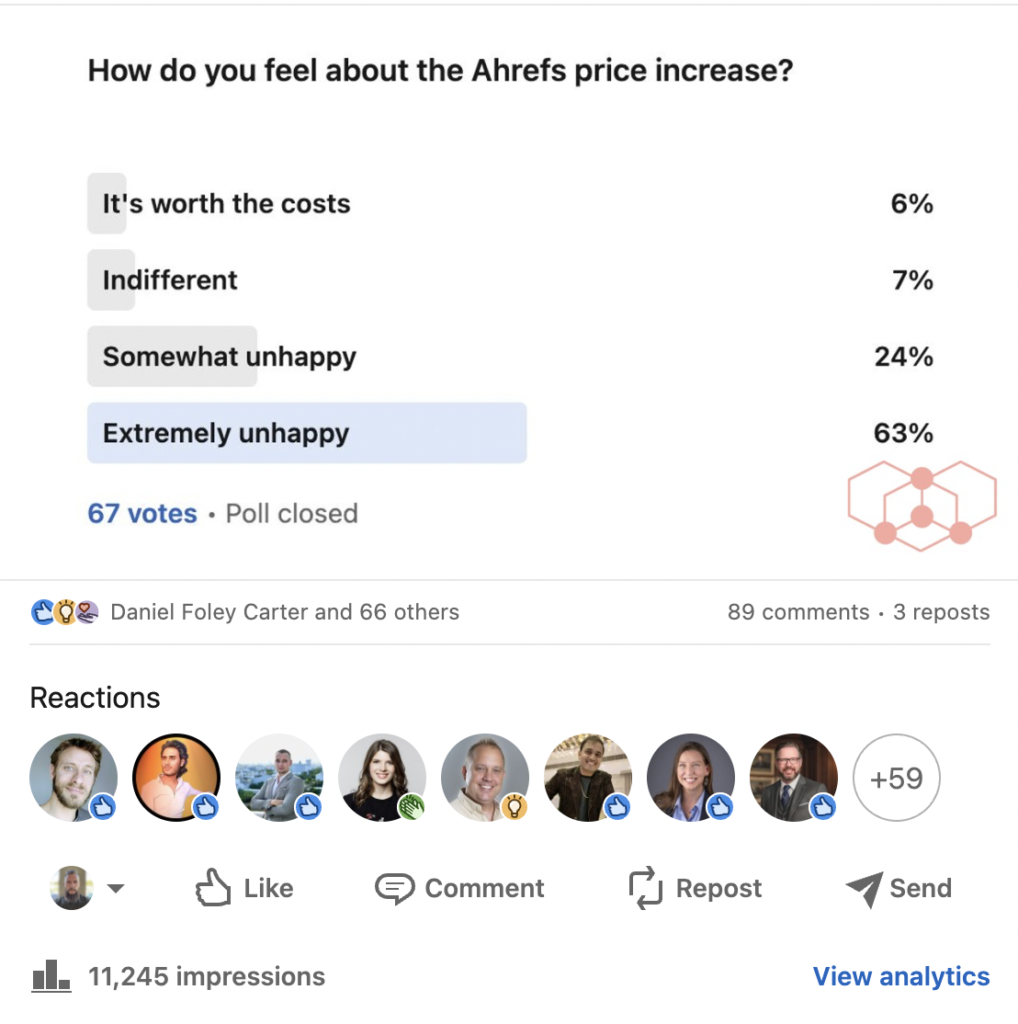
For instance, I recently conducted a concise and straightforward survey on LinkedIn to ascertain whether the recent price hikes by Ahrefs were a source of concern or frustration for SEO professionals.
The findings revealed that a majority of respondents expressed dissatisfaction with the price increases.
With only 67 votes, this survey lacks the statistical significance needed to draw meaningful insights regarding the sentiment of Ahrefs’ extensive customer base towards the price adjustment.
Moreover, the survey fails to delve into the fact that many still regard Ahrefs as notably swifter and offering more valuable data points compared to Semrush, particularly in link analysis, media research, and reporting applications. Additionally, Ahrefs boasts a substantially larger dataset than majestic.com, despite both platforms featuring a comparable user interface.
Nonetheless, a survey of this nature does indicate a level of interest in the topic, suggesting it as a potential subject for a more comprehensive survey. Notably, posts regarding the survey garnered over 11,000 impressions, nearly 70 likes, 89 comments, and three reposts, underscoring the relevance and engagement surrounding the discussion.
This approach involves leveraging publicly available data to uncover trends or connections between data points that have yet to be explored. Subsequently, this data is transformed into visual representations such as charts, graphs, tables, or infographics, which are then presented to the media. To provide context and significance to the data within a newsworthy narrative, an internal expert offers commentary.
For those who struggle with storytelling, listening to Loren Baker’s podcast featuring Ryan Kutscher discussing content and brand storytelling could be beneficial. Kutscher introduced the concept of ikigai, which centers on discovering one’s true purpose and passion. He emphasized that to craft a compelling story, one must be genuinely enthusiastic about the subject matter.
Data campaigns mirror this philosophy. Identifying topics that resonate with internal experts ensures that the data presented is engaging and impactful.
Crafting a compelling visual story from public data or any research project can follow a straightforward process:
Pro Tip: Recognize that journalists may remove links, branding, or source information from your visuals. To ensure the longevity and impact of your story, supplement it with indispensable commentary from an expert whose expertise aligns with the subject matter. This commentary should remain even if the source or graphics are stripped away, with a mention of the brand for attribution.
Employing existing research alongside analyst commentary is a strategic tactic aimed at gathering and scrutinizing information pertaining to a particular market.
This approach encompasses a spectrum of details, ranging from market size, growth patterns, and prevailing trends to the competitive landscape and buyer behaviors.
An expert is tasked with contextualizing the insights derived from this research through expert commentary. Both the data and commentary serve as valuable resources for journalists, aiding them in crafting content or elucidating concepts to their audience.
Define Objectives and Queries: Research and commentary should address audience inquiries. What aspects of a market do you aim to comprehend? What queries are potential customers posing? What challenges does your target persona encounter?
Gather Data: Acquire existing reports or raw data sources. These may include industry reports, SWOT analyses, market segmentation studies, market forecasts, trend analyses, and more.
Conduct Data Analysis: Analysts will utilize available reports and data to generate charts and graphs, subsequently delving into the data to uncover valuable insights.
Synthesize Discoveries: Compile a list of key insights extracted from all data sources. Look for significant implications within the findings.
Expert Commentary: Engage an industry expert to provide commentary on the research and insights. This should offer a distinctive viewpoint that enhances reader understanding. Experts can transform data or information into actionable insights.
Pro Tips:
Utilize Google search with the format “keyword intitle:report type” to find relevant reports. For instance, search “SEO intitle:industry report” to locate an SEO industry report.
Ensure that expert commentary and insights are framed in a manner conducive to actionable steps for individuals with specific roles and challenges.
Data newsjacking within digital PR is a strategic approach centered on scrutinizing prevailing news narratives or trend trajectories, followed by conducting primary or secondary research to fashion a narrative based on data or statistical insights.
The process entails identifying stories already backed by data and subsequently unearthing data-driven perspectives that either challenge or reinforce the initial findings.
Employing this technique not only associates your brand or expertise with trending narratives but also furnishes journalists with valuable data to enrich their storytelling endeavors.
The procedure for this entails:
This technique accommodates both primary and secondary data sources, with secondary data being notably quicker to gather and analyze.
Digital PR for SEO represents a significant departure from traditional link building tactics, prioritizing audience engagement and trust establishment through content dissemination and expertise sharing.
It transcends mere link acquisition, encompassing data-informed campaigns, compelling storytelling, and targeted media outreach to foster authentic connections with both audiences and journalists.
The crucial lesson to glean from this is evident: Effectively merging SEO and PR entails generating value via data-driven narratives and storytelling that strike a chord with both consumers and the press.
While the significance of links, brand mentions, quotes, and citations remains paramount, their role today mirrors what link profiles represented five years ago.
Original news from SearchEngineJournal